
Do you have an interest in analyzing data using natural language? Discover the process by using the Python library PandasAI. Understanding and analyzing data is essential in a world where it is vital. Nevertheless, conventional data analysis can be intricate. As such, PandasAI is implemented. It facilitates data analysis by enabling natural language communication with the data. By converting your questions into code for data analysis, Pandas AI functions. It uses the widely used pandas library in Python. PandasAI is a Python library that extends the widely recognized data manipulation and analysis tool pandas to incorporate Generative AI capabilities. It is not intended to replace pandas; rather, it is designed to supplement them. PandasAI adds a conversational aspect to pandas (and other frequently used data analysis libraries), allowing you to interact with your data using natural language queries.
This article will provide a comprehensive tutorial on setting up Pandas AI, applying it to a real-world dataset, generating graphs, investigating shortcuts, and examining the tool’s strengths and limitations. Upon its completion, it will enable you to conduct data analysis using natural language more effortlessly and intuitively. Therefore, let us explore the intriguing realm of natural language data analysis using Pandas AI.
Setting Up Your Environment
Installing the PandasAI library is imperative to commencing the use of PandasAI. For this endeavor, a Jupyter Notebook is used. However, Google Collab or VS Code may be used depending on the needs. Additionally, installing the Open AI Python SDK ensures a seamless experience when using Open AI Large Language Models (LLMs).
# Installing Pandas AI
!pip install pandas-ai
# Pandas AI uses OpenAI's language models, so you need to install the OpenAI Python SDK
!pip install openai
Let us now import every required library.
# Importing necessary libraries
import pandas as pd
import numpy as np

# Importing PandasAI and its components
from pandasai import PandasAI, SmartDataframe
from pandasai.llm.openai import OpenAI
The API aspect is a key component of data analysis with PandasAI. This tool supports several Large Language Models (LLMs) and LangChains models to generate code from natural language queries. This helps make data analysis more user-friendly and accessible. PandasAI can work with various types of models because it is versatile. These models include Hugging Face, Azure OpenAI, Google PALM, and Google VertexAI, each contributing unique strengths to enhancing PandasAI’s capabilities.
Remember to use the proper API keys to use these models. By using these keys to validate your requests, you can harness the capabilities of these sophisticated language models for data analysis. Ensure your API keys are available when setting up PandasAI for your applications. The API Key can be retrieved and exported as an environment variable. In the following section, you will learn how to use PandasAI with various types of large language models (LLMs) from Hugging Face Hub and OpenAI.
Using Large Language Models
You can designate an LLM in the pandasai.json file or choose one by instantiating one and passing it to the SmartDataFrame or SmartDatalake constructor. If the model requires one or more parameters, they may be passed to the constructor or specified in the llm_options param parameter of the pandasai.json file.
{
  "llm": "OpenAI",
  "llm_options": {
    "api_token": "API_TOKEN_GOES_HERE"
  }
}
How To Use OpenAI models?
To use OpenAI models, you need a valid OpenAI API key, which is available for acquisition at this location.
After obtaining an API key, an OpenAI object can be instantiated.
#We have imported all necessary libraries in privious step

llm = OpenAI(api_token="my-api-key")
pandas_ai = SmartDataframe("data.csv", config={"llm": llm})
Replace “my-api-key” with the initial API key.
You could also instantiate the OpenAI object without passing the API key by setting the OPENAI_API_KEY environment variable.
# Set the OPENAI_API_KEY environment variable
llm = OpenAI() # no need to pass the API key, it will be read from the environment variable
pandas_ai = SmartDataframe("data.csv", config={"llm": llm})
To pass through while behind an explicit proxy, you can set the OPENAI_PROXY environment variable or specify openai_proxy when instantiating the OpenAI object.
Note: Keep track of your token usage to control costs when using the PandasAI library for data analysis with your API key.
Curious how to accomplish this? Execute the subsequent token counter code to obtain a comprehensive overview of your token consumption and the associated fees. This will help you effectively manage your resources and prevent billing surprises. You can tally the number of tokens used by a prompt as follows.
"""Example of using PandasAI with a pandas dataframe"""

from pandasai import SmartDataframe
from pandasai.llm import OpenAI
from pandasai.helpers.openai_info import get_openai_callback
import pandas as pd
llm = OpenAI()
# conversational=False is supposed to display lower usage and cost
df = SmartDataframe("data.csv", {"llm": llm, "conversational": False})

with get_openai_callback() as cb:
    response = df.chat("Calculate the sum of the gdp of north american countries")
    print(response)
    print(cb)
You will achieve similar results.
#  The sum of the GDP of North American countries is 19,294,482,071,552.

#  Tokens Used: 375
#   Prompt Tokens: 210
#   Completion Tokens: 165
# Total Cost (USD): $ 0.000750
If you have limited credit, remember to maintain a record of the total.
How To Use Hugging Face Models?
You must possess a HuggingFace API key to use HuggingFace models. You can obtain an API key and establish a HuggingFace account on this page. Once an API key has been obtained, one of the HuggingFace models can be instantiated using it. PandasAI currently supports the following HuggingFace models.
- Starcoder – bigcode/starcoder
- Falcon – tiiuae/falcon-7b-instruct
from pandasai.llm import Starcoder, Falcon
llm = Starcoder(api_token="my-huggingface-api-key")
                    # or
llm = Falcon(api_token="my-huggingface-api-key")
df = SmartDataframe("data.csv", config={"llm": llm})
Instead, you could instantiate the HuggingFace object without passing the API key by setting the HUGGINGFACE_API_KEY environment variable.
from pandasai.llm import Starcoder, Falcon
llm = Starcoder() # no need to pass the API key, it will be read from the environment variable
                                       # or
llm = Falcon() # no need to pass the API key, it will be read from the environment variable
df = SmartDataframe("data.csv", config={"llm": llm})
Falcon and Starcoder are both LLM models offered by Hugging Face. Both OpenAI and Hugging Face LLMs models have been effectively used in our environment, which we have set up. Let us now proceed with our voyage of data analysis. The dataset Big Mart Sales data, which details the sales of various products in various Big Mart outlets, will be used. There are 8524 rows and 12 columns in the dataset. At the end of the article, you will find the link.
Data Analysis With PandasAI
Having effectively imported and installed all requisite libraries, we may load our dataset.
Load the Dataset
You can choose one by instantiating an LLM and passing it to the SmartDataFrame. The dataset link is provided at the article’s end.
#Load the dataset from device
path = r"D:\Pandas AI\Train.csv"
df = SmartDataframe(path)
Use OpenAI’s LLM model
Following the loading of our data. I intend to apply OpenAI’s LLM paradigm to the PandasAI framework.
llm = OpenAI(api_token="API_Key")
pandas_ai = PandasAI(llm, conversational=False)
Every Good! Let’s now attempt to use prompts.
Print the first 6 rows of our dataset
We shall endeavor to load the initial six rows by delivering directives.
Result = pandas_ai(df, "Show the first 6 rows of data in tabular form")
Result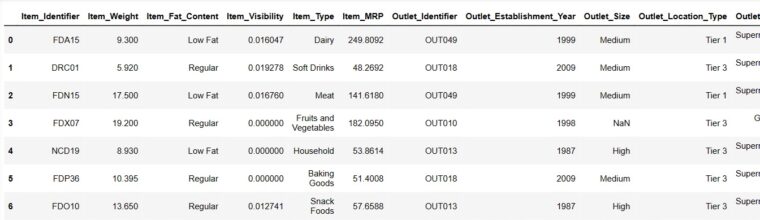
That was incredibly swift! Let’s examine our dataset in detail.
Generating Descriptive Statistics of DataFrame
# To get descriptive statistics
Result = pandas_ai(df, "Show the description of data in tabular form")
Result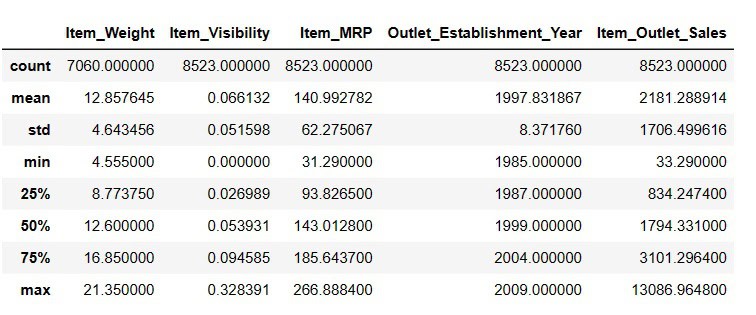
Item_Weigth contains 7060 values; there may be some values lacking.
Find Missing Values
Using Pandas AI, there are two methods for finding absent values.
#Find missing values
Result = pandas_ai(df, "Show the missing values of data in tabular form")
Result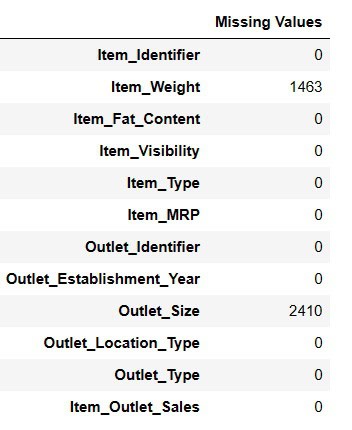
# Shortcut for Data Cleaning
df = SmartDataframe('data.csv')
df.clean_data()
The data frame will undergo data cleansing using this shortcut. Let us now complete the lacking null values.
Fill Missing Values
#Fill Missing values
result = pandas_ai(df, "Fill Item Weight with median and Item outlet size null values with mode and Show the missing values of data in tabular form")
result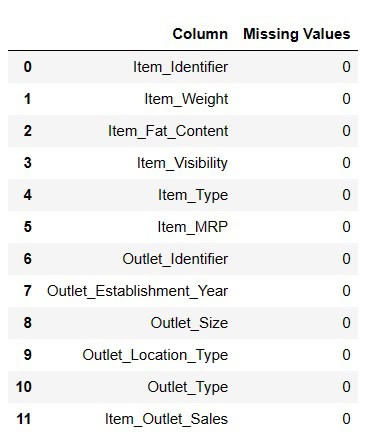
While this method is practical for populating null values, I encountered some difficulties when attempting to do so.
# Shortcut for Fill Null Values
df = SmartDataframe('data.csv')
df.impute_missing_values()
By using this shortcut, absent values in the data frame will be imputed.
Drop Null Values
One possible approach to remove all null values from the df is to use this method.
result = pandas_ai(df, "Drop the row with missing values with inplace=True")
result
Data analysis is essential for businesses, governments, researchers, and individuals to spot trends, both short-term and long-term. Let’s look at the general sales trend since the company was founded.
Finding Sales Trend
# finding trend in sales
result = pandas_ai(df, "What is the overall trend in sales over the years since outlet establishment?")
result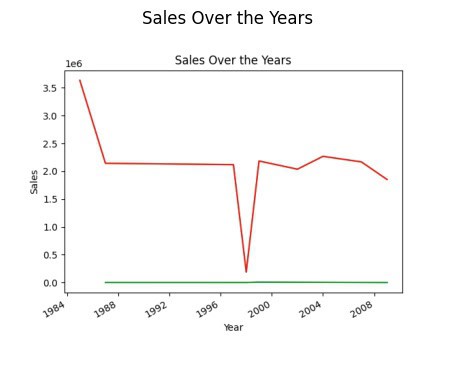
After restarting the kernel and rerunning the entire process, the initial plot generation was somewhat sluggish, but it resumed quickly.
# Shortcut to plot line plots
df.plot_line_chart(x = ['a', 'b', 'c'], y = [1, 2, 3])Using this shortcut, a line graph of the data frame will be plotted. You may wonder why the trend is declining. This is because we lack data from 1989 to 1994.
Finding Year of Highest Sales
Find the year with the greatest sales now.
# finding year of highest sales
result = pandas_ai(df, "Explain which years have highest sales")
result![]()
Thus, 1985 is the year with the most sales. However, I want to determine which Item type produces the most average sales and which produces the least average sales.
Highest and Lowest Average Sales
# finding highest and lowest average sale
result = pandas_ai(df, "Which item type generates the highest average sales, and which one generates the lowest?")
result![]()
Other food categories have the lowest average sales compared to starchy foods. To ensure others have the highest sales, adjust your prompts accordingly. Simply magnificent! I now want to find out how sales are distributed among various outlets.
Distribution of Sales Across Different Outlets
Supermarkets of types 1/2/3, grocery stores, and supermarkets are the four types of outlets.
# distribution of sales across different outlet types since establishment
response = pandas_ai(df, "Visualize the distribution of sales across different outlet types since establishment using bar plot, plot size=(13,10)")
response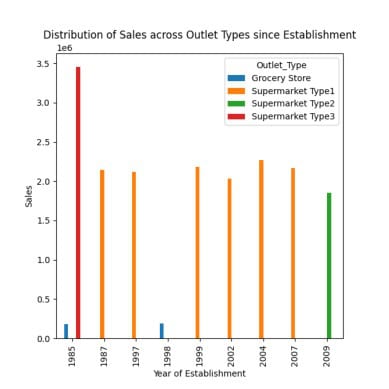
This plot emphasizes the highest sales in 1985 from supermarket type 3 outlets, as was observed in earlier prompts.
# Shortcut to Plot Bar Chart
df = SmartDataframe('data.csv')
df.plot_bar_chart(x = ['a', 'b', 'c'], y = [1, 2, 3])
The data frame’s bar chart will be plotted using this shortcut.
# Shortcut to Plot Histogram
df = SmartDataframe('data.csv')
df.plot_histogram(column = 'a')
Using this keyword shortcut, the data frame will be histogram-plotted. Let’s now find out what the typical sales are for items with ‘Regular’ and ‘Low Fat’ fat content.
Find Averages Sales for Items with fat Contents
# finding index of a row using value of a column
result = pandas_ai(df, "What is the average sales for the items with 'Low Fat' and 'Regular' item fat content?")
result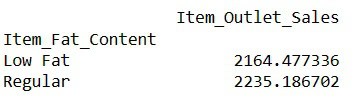
The ability to compose prompts in this manner enables one to compare multiple products.
Average Sales for Each Item Type
This analysis aims to compare the average sales of all products.
#Average Sales for Each Item Type
result = pandas_ai(df, "What are the average sales for each item type over the past 5 years?, use pie plot, size=(6,6)")
result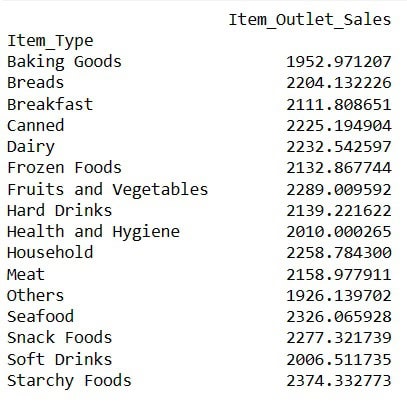
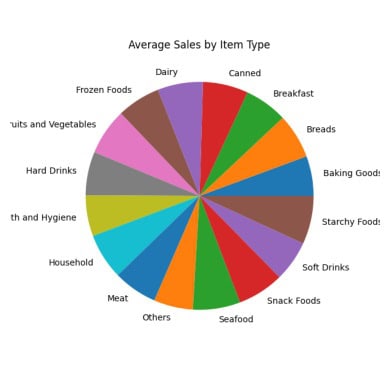
The virtually identical sales figures recorded in each segment of the pie chart make them comparable.
# Shortcut to Plot Pie Chart
df.plot_pie_chart(labels = ['a', 'b', 'c'], values = [1, 2, 3])The data frame will be plotted as a pie chart using this shortcut.
Top 5 Highest Selling Item Types
After comparing all products based on their average sales, I want to list the top five items with the highest sales.
#Finding top 5 highest selling items
result = pandas_ai(df, "What are the top 5 highest selling item type based on average sells? Write in tablular form")
result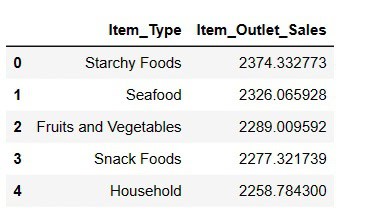
Starchy Foods, as anticipated, is the best-selling product in terms of average sales.
Top 5 Lowest Selling Item Types
result = pandas_ai(df, "What are the top 5 lowest selling item type based on average sells?")
result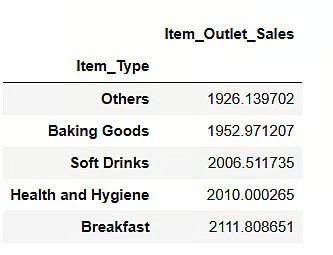
It may come as a surprise to learn that fizzy beverages are ranked last in sales. However, it is essential to note that this information only provides data through 2008, and the soft drink trend gained momentum a few years later.
Sales Of Product Categories
PandasAI still generated the plots even when I substituted “product category” for “item type,” demonstrating its understanding of comparable terms.
result = pandas_ai(df, "Give a stacked large size bar chart of the sales of the various product categories for the last FY")
result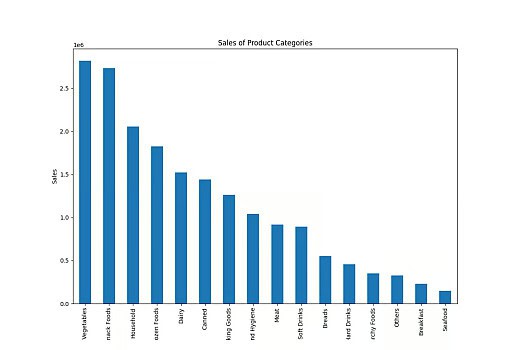
It is worth noting that when we input instructions into a PandasAI along with a written prompt, the AI generates results exclusively derived from that prompt. It does not analyze your previous prompts to provide more precise responses. Nonetheless, it is possible to accomplish this functionality with the aid of a contact agent.
Chat Agent
Engage in dynamic conversations with the chat agent, where the agent maintains context throughout the exchange. This allows for more substantive and interactive dialogues.
One of the key features of this interaction is Context Retention, in which the agent retains the conversation history. This enables seamless, context-aware interactions. Using the Clarification Questions method, you can request clarification on any aspect of the conversation, thereby ensuring that you have a complete understanding of the information provided.
Furthermore, the Explain method can provide comprehensive elucidations regarding the agent’s reasoning behind a specific solution or response. This provides transparency and valuable insights into the agent’s approach to decision-making.
To augment your interactions with the chat agent, do not hesitate to commence conversations, request clarifications, or delve into explanations.
from pandasai import Agent
agent = Agent(df, config={"llm": llm}, memory_size=10)
result = agent.chat("Which are top 5 items with highest MRP")
result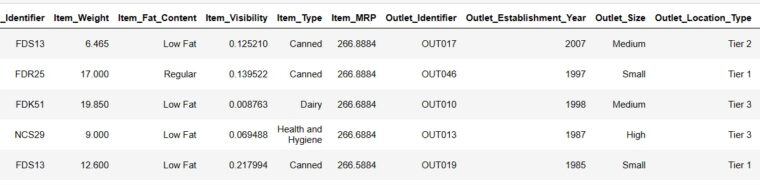
In contrast to a SmartDatalake or SmartDataframe, an agent will be able to respond to multi-turn conversations and maintain track of the conversation’s state. Proceed to examine the merits and drawbacks of PandasAI.
PandasAI Advantages
Using Pandas AI has several advantages that make it an invaluable tool for data analysis.
Accessibility – PandasAI makes data analysis simpler, making it accessible to a broad range of users. Individuals of all technical backgrounds can use it to answer business questions and extract insights from data.
Natural Language Queries – Natural Language Queries (NLP) make data investigation and analysis more user-friendly by allowing users to pose questions directly to the data and receive responses. Thanks to this feature, even non-technical users can effectively interact with data.
Agent Chat Functionality – The agent chat feature uses previous chat history to deliver context-aware responses, whereas the chat function enables users to interact with data interactively. This encourages a conversational and dynamic approach to data analysis.
Data Visualization – PandasAI offers a wide range of data visualization options, such as heatmaps, scatter plots, bar plots, pie charts, and line plots. These visualizations help users understand and display data patterns and trends.
Time-Saving Shortcuts – The availability of time-saving shortcuts and features streamlines the data analysis procedure, enabling users to work more effectively and efficiently.
File Compatibility – PandasAI exhibits compatibility with a wide range of file formats, encompassing CSV, Excel, Google Sheets, and numerous others. This flexibility allows users to work with data from various sources and formats.
Custom Prompts – Thanks to this feature, users can generate custom prompts by integrating Python code with straightforward instructions. This allows users to customize their interactions with data to meet particular requirements and queries.
Save Changes – The capability to save modifications performed on dataframes guarantees the preservation of one’s work, enabling the user to revisit and distribute their analysis at any moment.
Custom Responses – Users can designate particular behaviors or interactions using the option to create custom responses, making the tool even more versatile.
Model Integration – PandasAI supports many language models, encompassing those developed by Hugging Face, Azure, Google Palm, Google VertexAI, and LangChain. This integration makes advanced natural language processing and understanding possible, improving the tool’s capabilities.
Built-in LangChain Support – The built-in support for LangChain models further broadens the range of available models and functionalities, enhancing the depth of analysis and insights derived from the data.
Understand Names – One notable feature of PandasAI is its ability to discern the relationship between column names and practical terminology. For example, the tool can still deliver pertinent and precise results even if you substitute “item type” for “product category” in your prompts. The capability to identify and associate synonyms with their corresponding data columns increases the utility for users and improves the tool’s flexibility in handling natural language queries.
Users should be aware of the limitations and difficulties that PandasAI presents even though it offers many advantages:
PandasAI Limitations
I observed the following limitations.
API Key Requirement – Having an API key is essential for using PandasAI. You might be unable to use the service if your OpenAI account lacks an adequate credit balance. It is important to note, however, that OpenAI grants new users a $5 credit, making the platform accessible to those who are new to it.
Processing Time – The service may encounter occasional delays in delivering results, potentially due to elevated usage or server load. Users should anticipate possible delays when submitting queries to the service.
Interpretation Of Prompts – The interpretation of prompts still needs to be completely developed, and the system’s capability to provide comprehensive explanations for the questions posed may differ in quality. Future development of PandasAI may enhance this particular aspect.
Prompt Sensitivity – Users should exercise caution when creating prompts, as even insignificant modifications can produce varying results. This sensitivity to wording and prompt structure may affect the consistency of results, particularly when working with data visualizations or more complex queries.
Limitations On Complex Prompts – PandasAI may need to manage more complex prompts or queries as effectively as simpler ones. Users need to be aware of the intricacy of their questions and ensure the tool is appropriate for their particular requirements.
Inconsistent DataFrame Changes – Users have reported problems when making changes to DataFrames, such as filling null values or removing null value rows, even when specifying ‘Inplace=True.’ This inconsistency can be vexing for users who are attempting to modify their data.
Variable Results – Restarting a kernel or executing the prompts again could possibly yield different results or interpretations of data. Users who need consistent and reproducible results may find this variability challenging, exclusive of certain prompts.
Here is the download link for the dataset. There is access to the code on GitHub.
Consider The Following:
Final Thoughts:
PandasAI provides a straightforward data analysis methodology, making it accessible to individuals lacking advanced coding expertise. In this article, I’ve covered how to set up and use PandasAI for data analysis, including creating graphs, handling invalid values, and using the agent conversation functionality.